Series of posts on improving performance when using Pandas
These posts are inspired by the work I did in improving performance when using pandas dataframes at a client. Also included are some of the questions learners posed during the tutoring I did. Also includes some notes on using large datasets (and some notes on Dask for parallelization)
GitHub Repository: Pandas super journey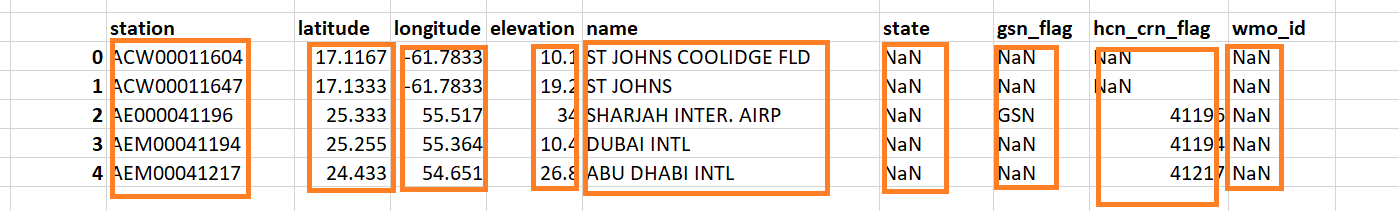
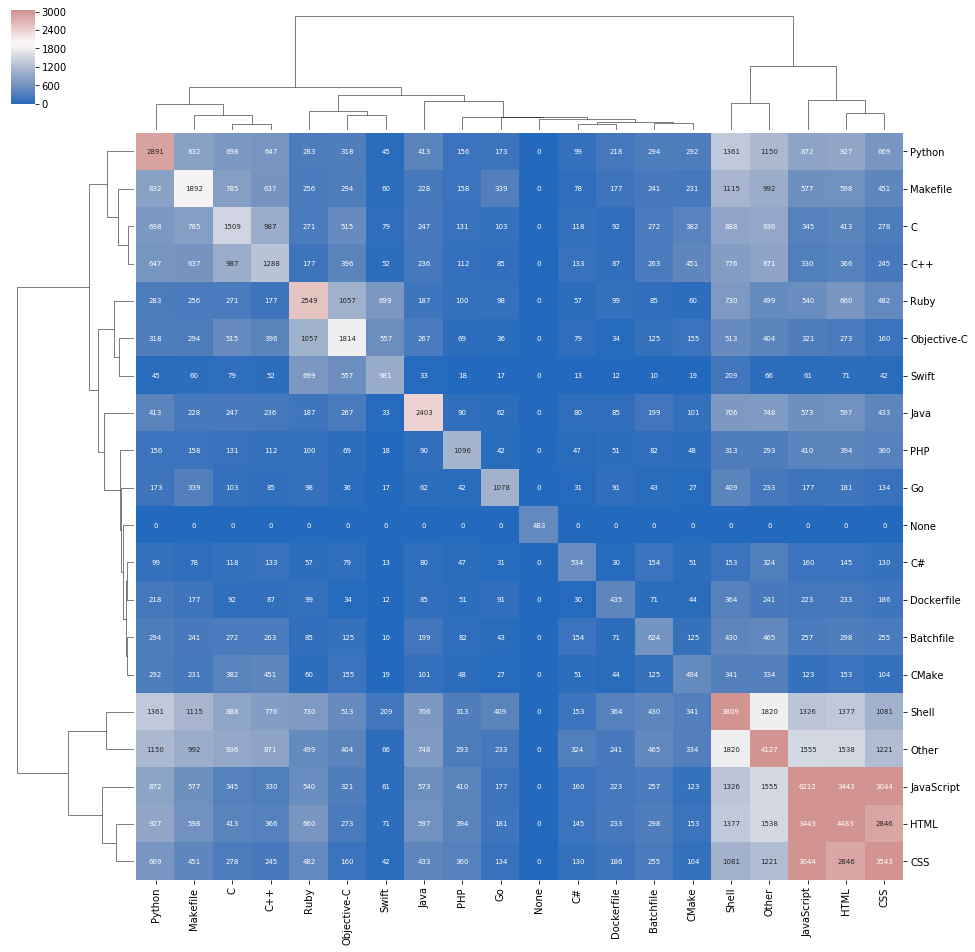
Visualization of GitHub repository data
Obtained open data on GitHub from Google BigQuery, and vizualized it using heatmap with dendrograms (scipy, plotly, seaborn), a chord diagram (d3, svg) and a force directed graph(d3, d3-force, svg) .
GitHub Repository: Github language analysisSee : Github repo analysis
Analysis of drug mortality and conditions in CT
Extension of a project that I worked on with by cohort in the UT Austin Data Science Bootcamp. Used Python, Pandas, Matplotlib and Folium to create visualiations to find patterns and trends. Linear regression line is fit to the data to predict the number of deaths for 2018. Chi-squared test is used to identify disproportionately affected groups.
GitHub Repository: Project 1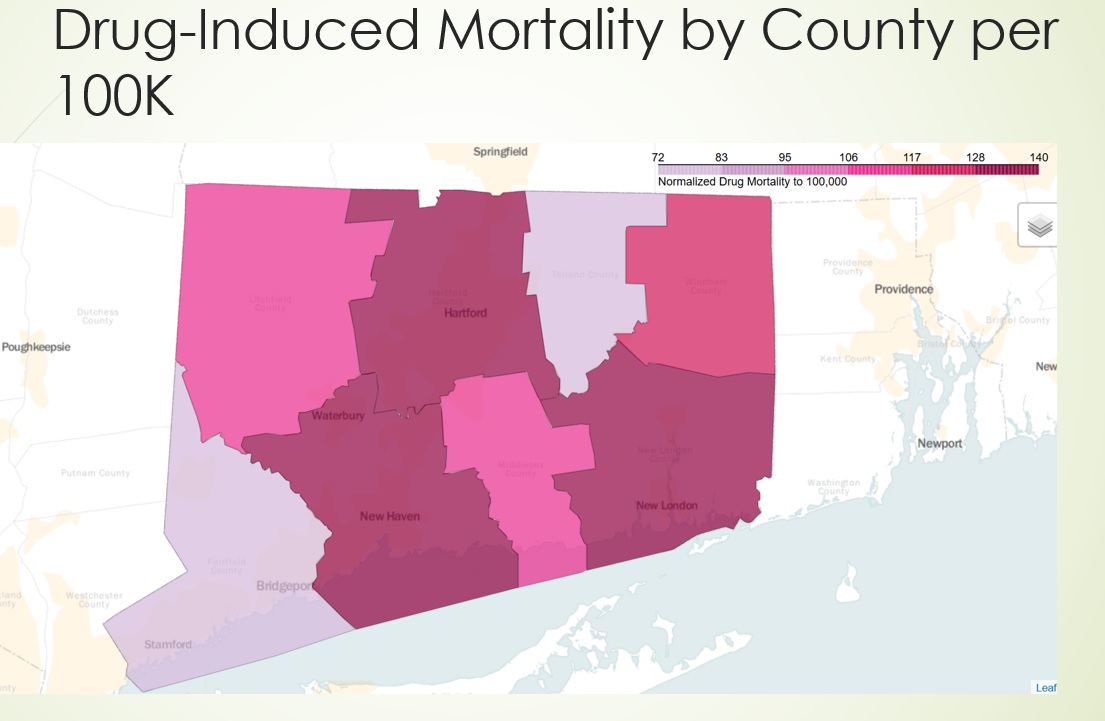
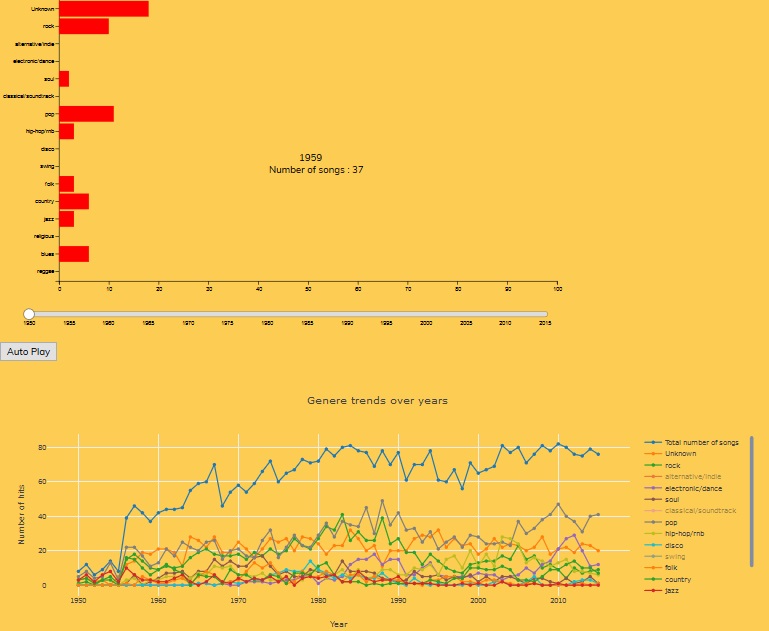
Billboard Trends
This work is part of a larger class project analyzing trends in music. It visualizes Billboard Music Top 100 from 1950 using JavaScript and D3. This was deployed to Heroku along with the rest of Flask application
GitHub Repository: Music PopularitySee on Heroku: Billboard Top 100 Vizualization
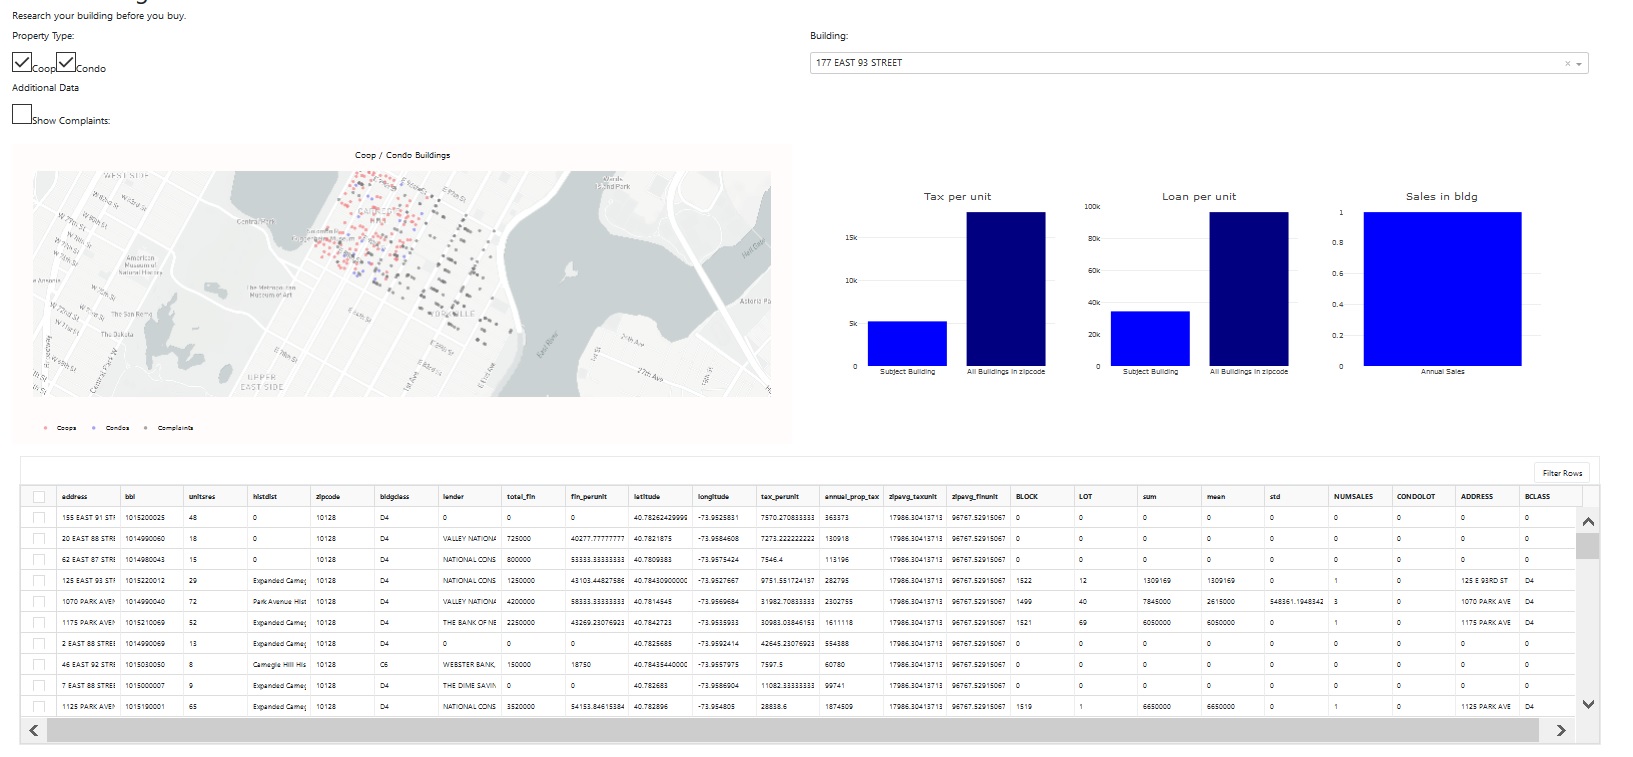
Dashboard showing NY real estate data
Dashboard showing and analyzing NY real estate data, LJH Ventures
Used Dash by Plotly to vizualize data on a map, and analyze it. Obtained tax information by extracting text from pdf documents. Deployed using AWS Elastic Beanstalk.
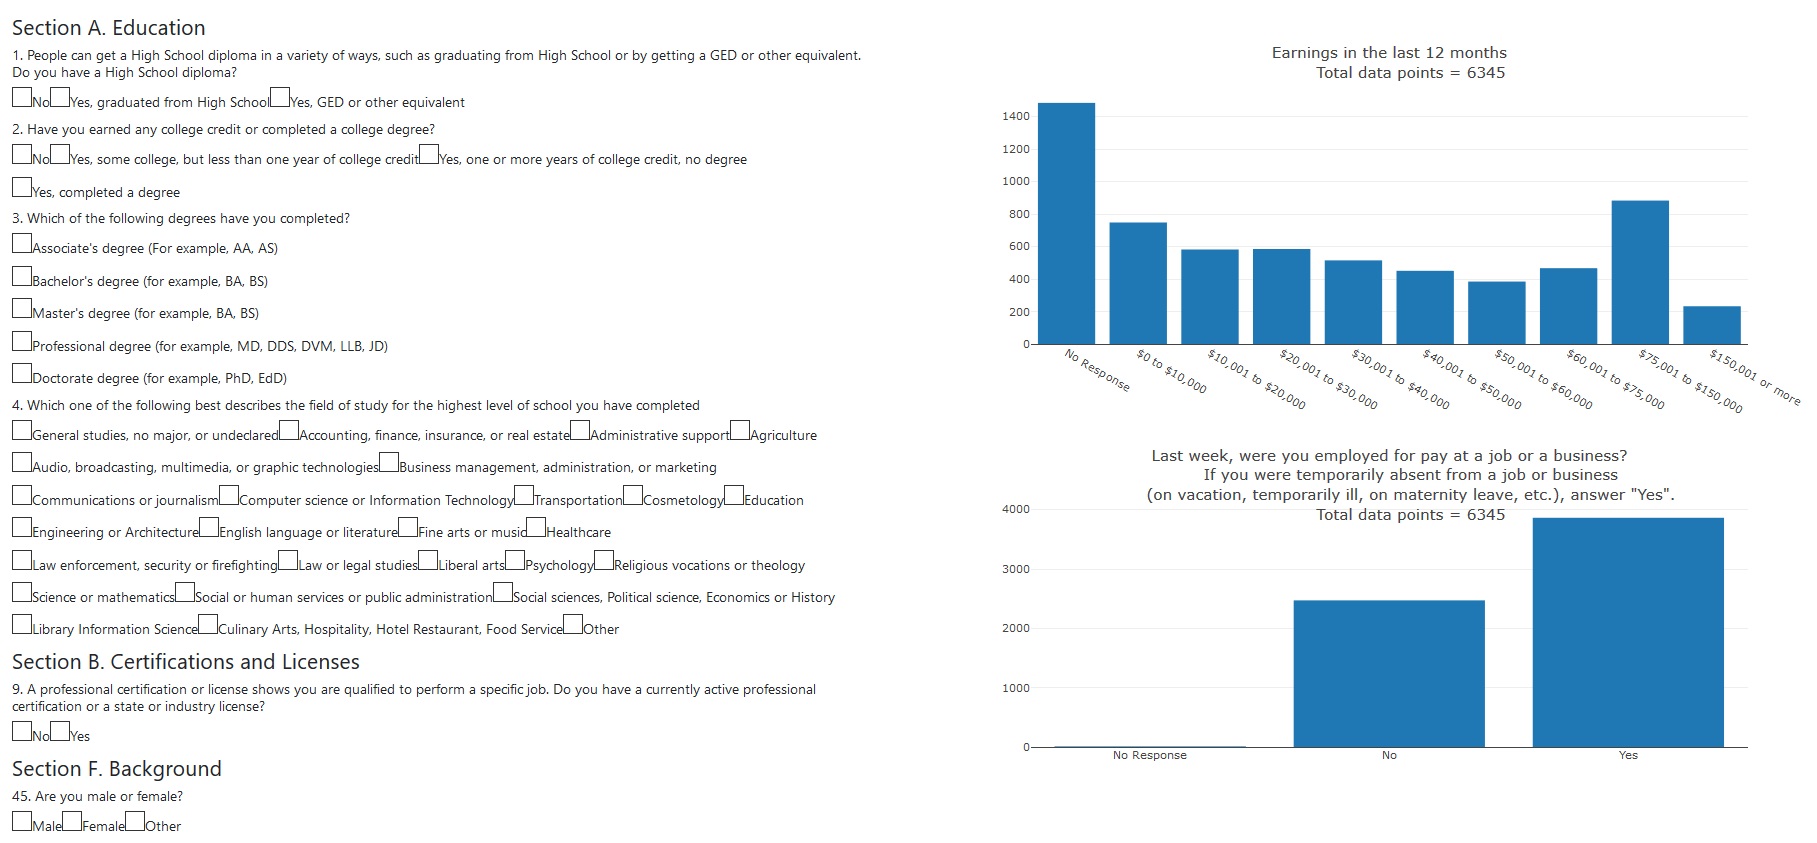
Education Survey Visualization
This work is part of a larger class project analyzing higher education costs, employability and student loans. It vizualizes some parts of the National Education and Attainment Survey using Dash by Plotly. This was deployed to Heroku along with the rest of Flask application
GitHub Repository: Higher EducationSee on Heroku: NEAS Vizualization
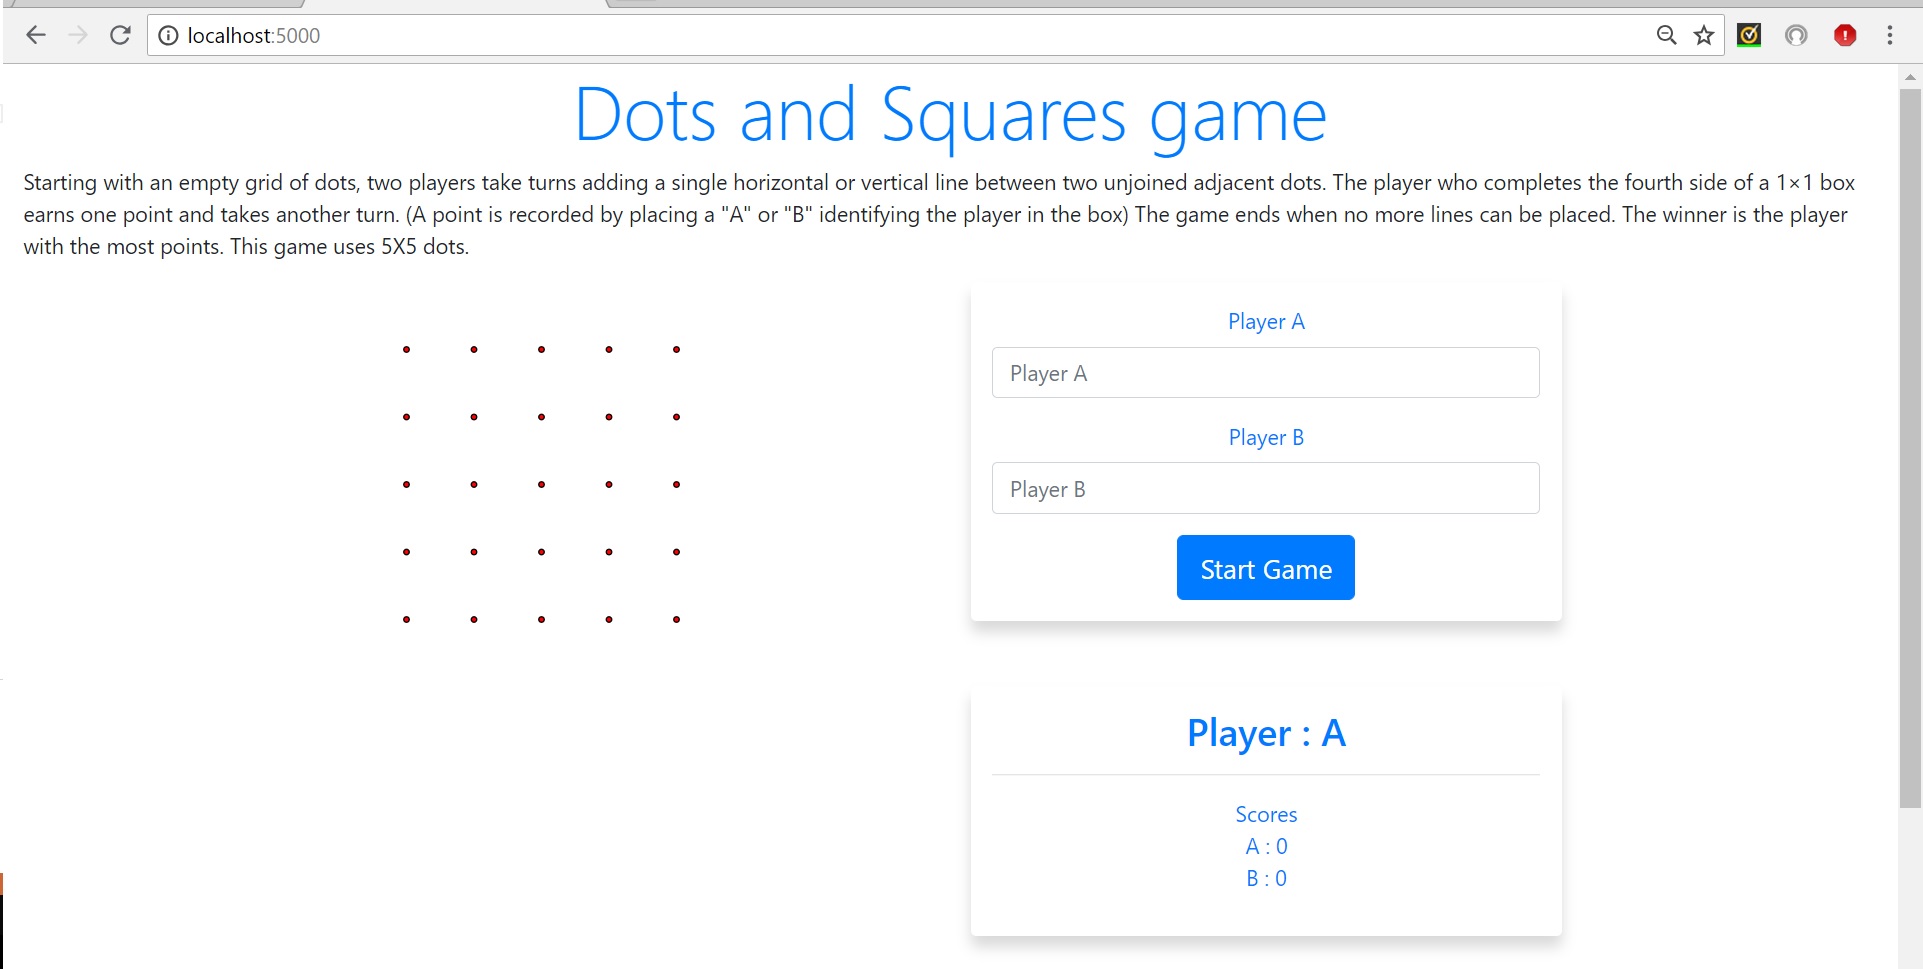
Classic dots and boxes game (JavaScript frontend)
Classic dots and boxes game implemented with JavaScript front-end so that it can be played in browser. Backend is in Python and the
webpages are rendered using Flask
GitHub Repository: dots_and_boxes
Play on Heroku: dots-boxes.herokuapp.com
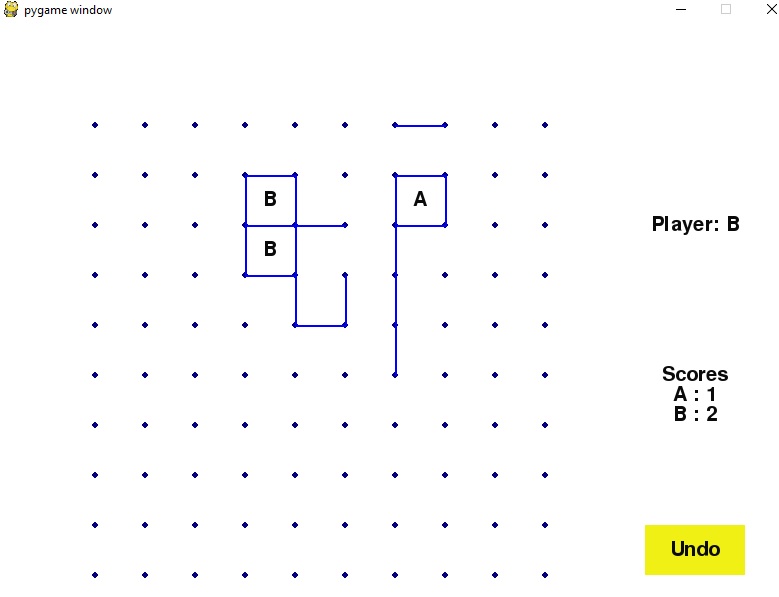
Classic dots and boxes game (Python version)
Classic dots and boxes game implemented as a Python package using PyGame. Unit tests included.
GitHub Repository: Pygame dots_and_boxes